 Visual Paradigm Desktop |
  Visual Paradigm Online
Transform Your Portfolio from Complex to Clear With
The Free BCG Matrix Analysis Tool is more than a data-entry form; it is a guided framework designed to help you analyze your business portfolio, make informed decisions, and align your team on a path to sustainable growth.
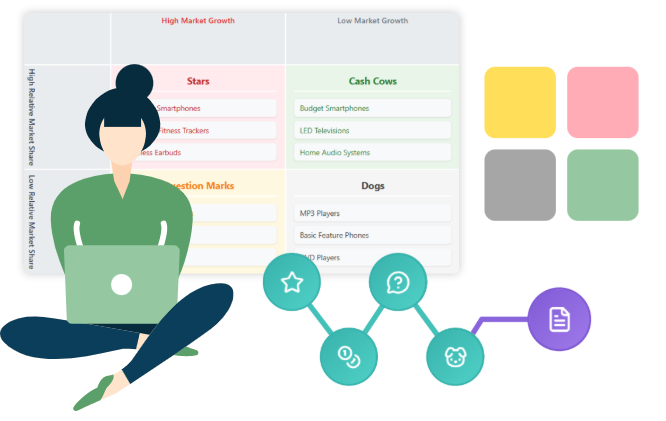
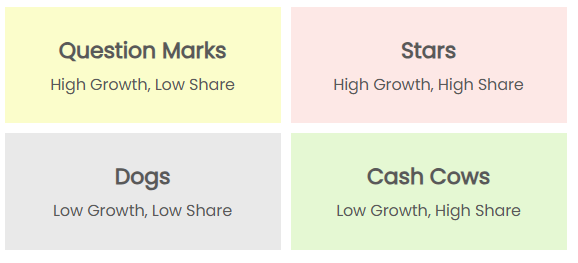
The BCG Matrix plots your business units on a 2×2 grid based on two key dimensions:
Market Growth Rate:
How fast is the industry growing? This indicates market attractiveness.
Relative Market Share:
How strong is your position compared to your largest competitor? This indicates competitive advantage.
The quality of your analysis depends on the quality of your data. This is the most crucial phase, requiring research and collaboration.
For Market Growth Rate (%)
This measures the annual growth of the entire market your SBU operates in, not just your SBU’s own growth.

Market Research Reports
Gartner, Forrester, Statista, Nielsen

Industry Publications
Financial Times, WSJ, specific trade journals

Financial & Government Data
Public company filings (10-K reports), economic data
Pro Tip:
Look for the Compound Annual Growth Rate (CAGR) for the next 3-5 years. A rate above 10% is generally considered high growth.
For Relative Market Share
This measures your SBU’s strength compared to its largest competitor using the formula: Your Share / Competitor’s Share.
")
Internal Sales & Finance Data
Your own revenue is the starting point.
")
Public Company Filings
Annual reports for publicly traded competitors.
")
Channel & Distribution Partners
They have insights into competitor sales volumes.
Pro Tip:
A value greater than 1.0 makes you the market leader. If competitor SBU data is unavailable, use overall company revenue as a proxy, but note the limitation.
The final report is your ultimate deliverable—a powerful communication tool that transforms complex data into clear insights, enabling confident, data-driven decision-making across your organization.
The Strategic Blueprint helps you bridge the gap between analysis and action. Use this free tool to:

Communicate with Impact
The at-a-glance matrix visualization makes complex portfolio dynamics instantly understandable. It creates a single source of truth to align stakeholders, from the boardroom to the project team.

Justify Resource Allocation
Provide a clear, data-backed rationale for funding your high-potential Stars and promising Question Marks, giving you the evidence to shift resources toward future growth engines.

Optimize & Profitability
Develop clear strategies to efficiently harvest your Cash Cows and use their profits to fuel innovation. Simultaneously, make objective decisions about divesting Dogs to free up capital.
It is best to perform a BCG analysis annually as part of your strategic planning cycle. You should also revisit it whenever there’s a significant market shift, a new competitor emerges, or your company’s strategic goals change. Think of it as a living document, not a one-time exercise.
Absolutely. For a startup or a new venture, the ‘SBUs’ can represent potential product ideas, target market segments, or different feature sets. The ‘Relative Market Share’ axis can be adapted to ‘Potential Competitive Advantage’ and ‘Market Growth’ to ‘Market Opportunity Size’. It helps prioritize focus and investment where it matters most, even before revenue.
This is a common challenge. If precise data is unavailable, use well-reasoned estimates based on industry reports, interviews with industry experts, and proxy data (e.g., a competitor’s overall company revenue if they are not diversified). The key is to be consistent in your assumptions across all SBUs and to document your estimation process.
‘Market Share’ is your SBU’s revenue as a percentage of the total market’s revenue. ‘Relative Market Share,’ however, specifically measures your strength against your single largest competitor (Your Share / Competitor’s Share). The BCG matrix uses the relative measure because it is a better indicator of competitive strength, brand power, and potential for economies of scale, which directly impacts profitability.
Stop guessing and start strategizing. Gain the clarity you need to drive growth and maximize profitability. Launch the tool and build your first BCG Matrix in minutes.
