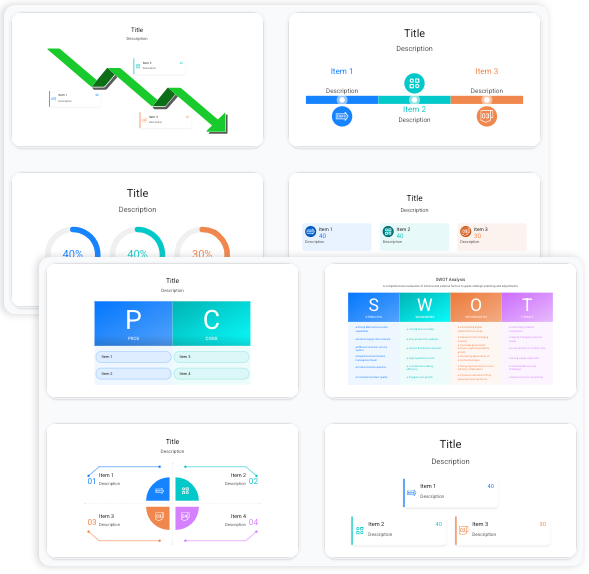
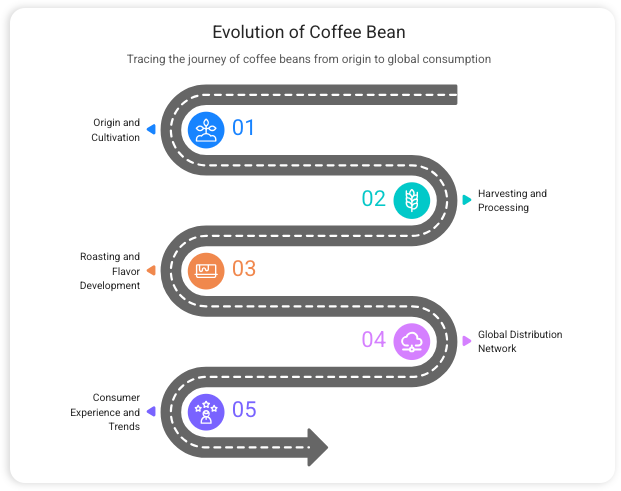
Perfect for “How-to” guides or showing how a small project grows into a big success.
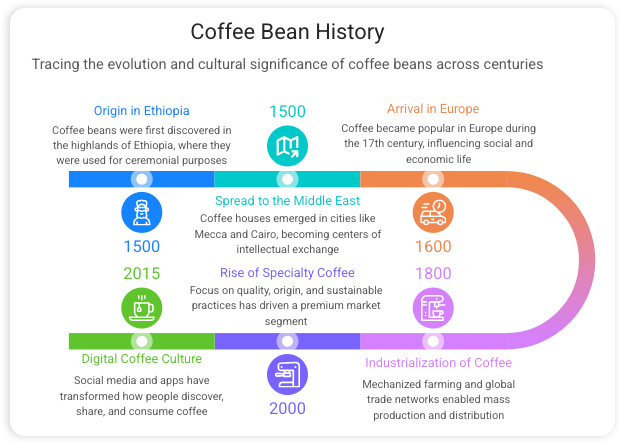
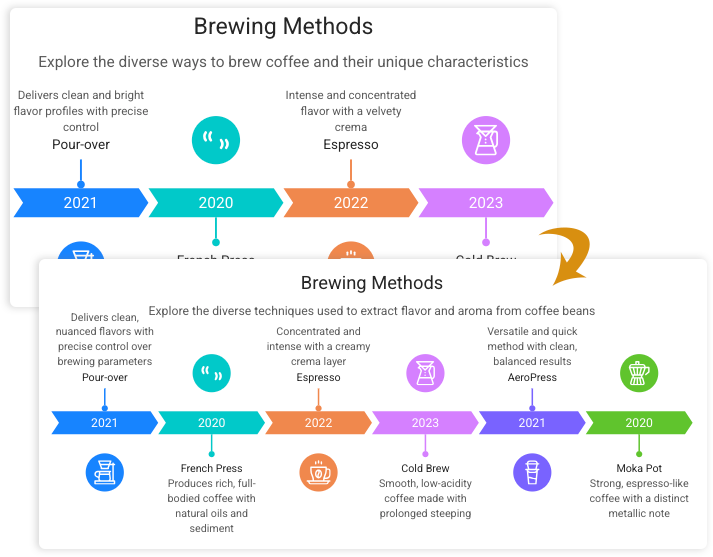
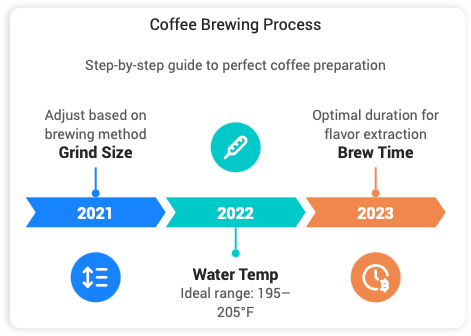
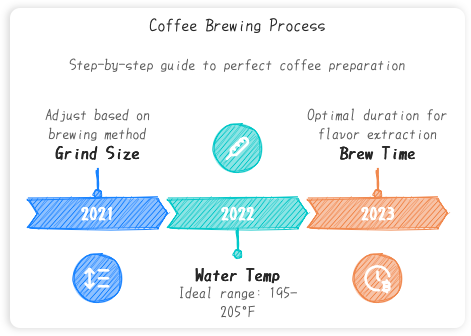
Use this to map out your goals for the year or show the journey of a product from start to finish.
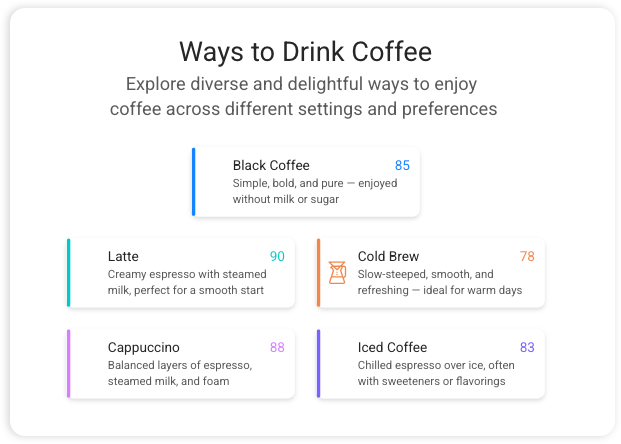
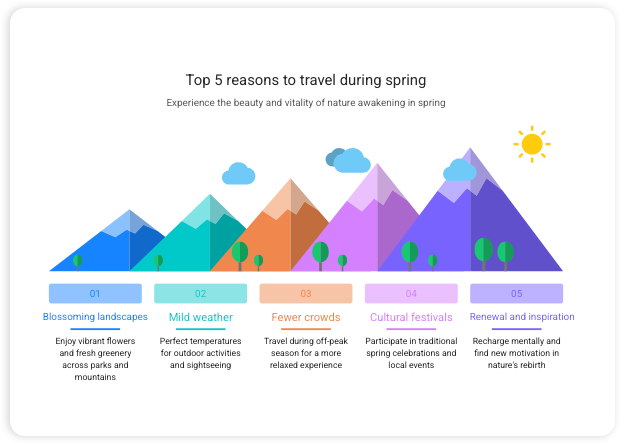
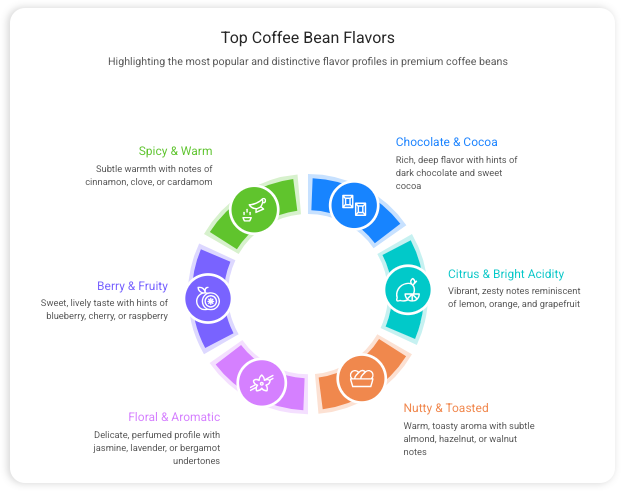
Great for quick checklists, “Top 5” tips, or organizing different features of your service.
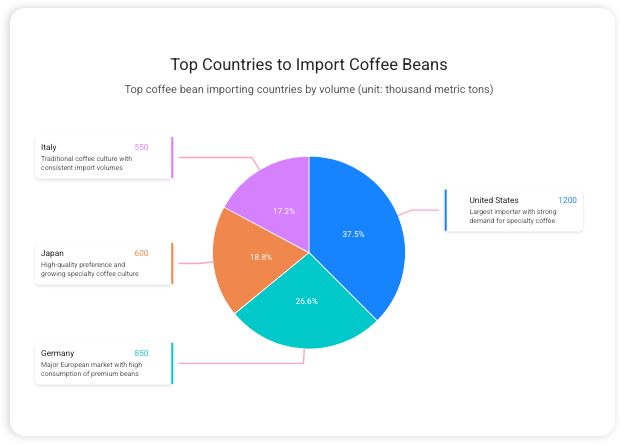
Turn boring numbers and percentages into easy-to-read charts that tell a story.
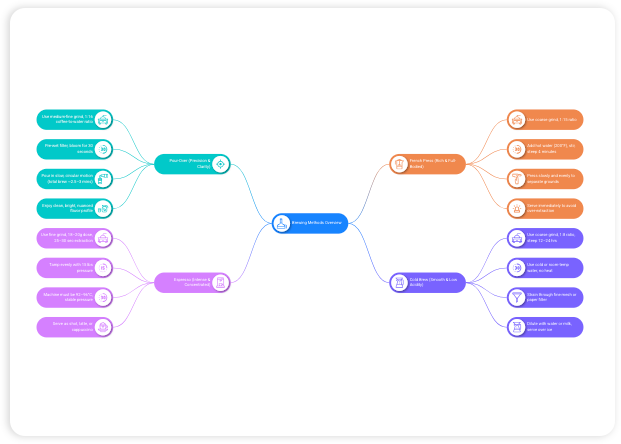
Best for showing how a team is organized or for brainstorming and connecting different ideas.
Use this to show how a customer goes from seeing an ad to making a purchase.
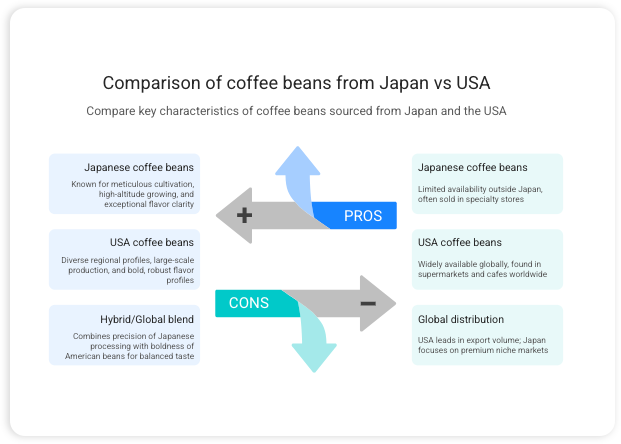
Perfect for a “This vs. That” chart or showing why your plan is better than the alternative.
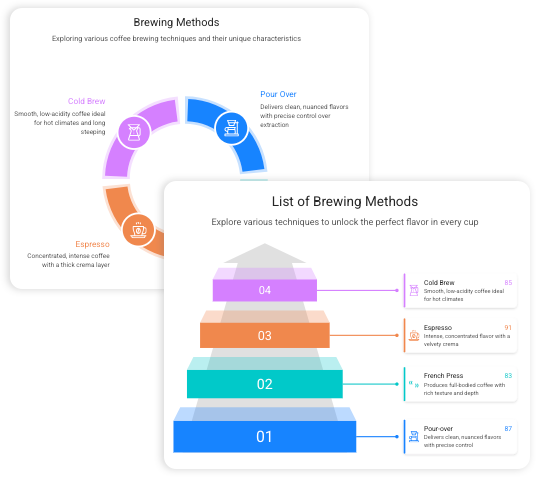
Ideal for showing priorities, like the most important tasks at the bottom and the final goal at the top.