 Visual Paradigm Desktop |
  Visual Paradigm Online
AI Image Translator Demo
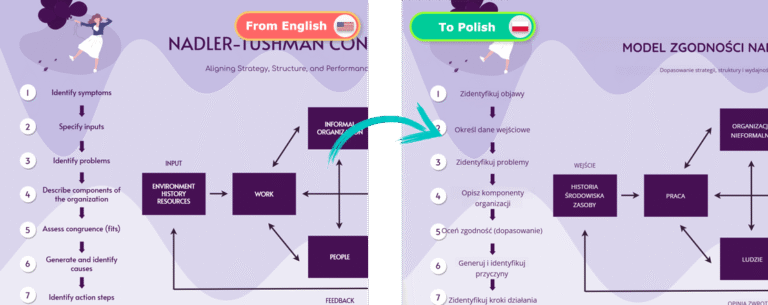
Looking for an easy way to translate text in images? Our AI-powered online image translator makes it simple to convert infographics, charts, and visuals into any language. In this guide, we’ll walk you through translating an infographic of the Nadler-Tushman Congruence Model from English to Polish. Follow these steps to get a seamless and polished translated image!
Start by uploading your image to our AI image translation tool. You can drag and drop the file directly into the upload area or click the Upload button to browse your files. Once the image is uploaded, select the target language – in this example, Polish – and click Process to start the translation. Our AI will analyze the text, recognize the content, and translate it automatically.
After translation, you might notice inconsistencies in font sizes across different text blocks. Some parts may appear too small, while others vary in size. Let’s fix that:
Select the text blocks on the left side of the infographic.
Unify the font size by the set to same size button
Enter a uniform font size in the settings panel.
Next, select the text inside the rectangular shapes. Use Shift-click to select multiple text blocks.
Increase the font size to ensure clarity.
Repeat these steps for any other labels that need resizing.
Now, the translated infographic is more readable and visually consistent!
Some text blocks inside the shapes may not be well aligned. To fix this:
Select the text blocks inside the rectangles
Set their vertical alignment to Center.
This ensures a clean, professional appearance for your translated image.
A strong, well-designed title makes your infographic stand out. To improve it, start by selecting the title text and increasing its font size for better prominence. Next, choose a more visually appealing font – for example, Quicksand – to enhance readability and style. Then, make any necessary edits to the translated content. Finally, bold the title and adjust its position slightly to ensure a balanced and professional appearance.
Once you’re satisfied with the final look, it’s time to save your translated infographic. Click the Export button at the top right of the interface, and download the high-quality translated image to your device. Now, you have a flawless Polish version of the Nadler-Tushman Congruence Model infographic, ready to be shared or used for your projects.
Experience the ease of translating text in images with our cutting-edge AI technology. Start using this Beta feature now and see how it transforms the way you communicate across languages.
