 Visual Paradigm Desktop |
  Visual Paradigm Online
Unlock Strategic Clarity for Your Business Portfolio With
Visualize your products, make data-driven decisions, and allocate resources with confidence using our intuitive Free BCG Matrix Analysis Tool.
Everything you need to perform a comprehensive portfolio analysis and present your findings effectively.

Intuitive Data Entry
Easily input your product or business unit data into organized tables for each BCG quadrant.

Action Steps
Receive standardized strategic summaries to guide your decision-making process for each quadrant.

Multiple Export Options
Export your complete analysis to PowerPoint, Markdown, or HTML for presentations and reports.

Project Management
Save your progress as a JSON file and load it back anytime to continue your analysis.

Responsive & Printable
The final report is optimized for printing, ensuring your hard copies look as good as the screen.
We focus on simplicity, power, and accessibility to deliver a best-in-class strategic planning experience.
Presentation-Ready
Export your analysis directly into formats like PowerPoint, perfect for board meetings, client presentations, and internal reviews.
Secure & Private
Your data is your own. The tool runs entirely in your browser. Nothing is saved on our servers, ensuring complete privacy.
Modern & Intuitive
A clean, user-friendly interface that makes complex portfolio analysis straightforward and even enjoyable.
Using our free tool goes beyond creating a chart—it empowers you to make smarter, more profitable decisions that shape the future of your business.

Enhanced Strategic Clarity
Gain a bird’s-eye view of your entire business portfolio, instantly identifying which products to invest in, harvest, or divest.
Optimized Resource Allocation
Make data-driven decisions on where to allocate your budget, talent, and time for maximum return on investment.
Improved Stakeholder Communication
Align your team, investors, and leadership with clear, professional reports that visually communicate your strategic direction.
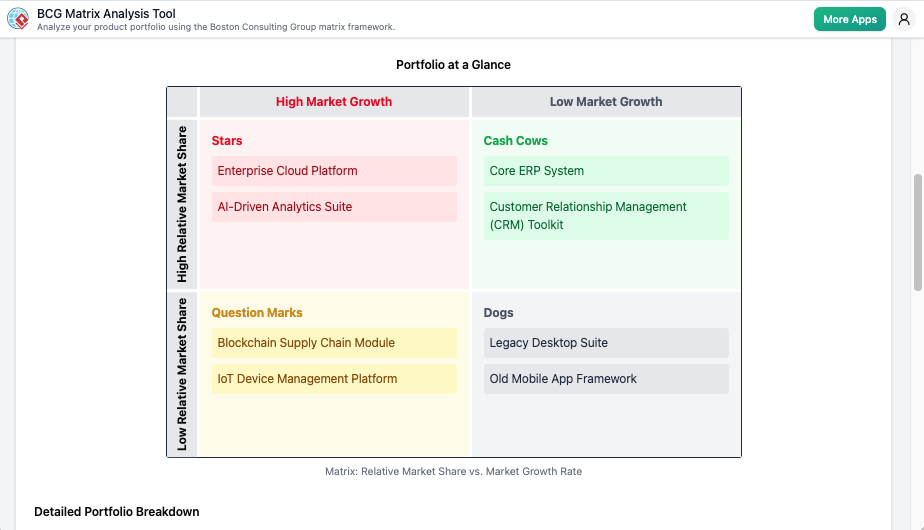
From data entry to a full strategic report in just a few clicks.
01 | Input Your Data
Use the step-by-step guide to enter details for your products across the four quadrants: Stars, Cash Cows, Question Marks, and Dogs.
02 | Visualize & Analyze
Instantly see your data come to life in the BCG Matrix and detailed summary tables. Understand your portfolio’s current state.
03 | Export Your Report
Generate a comprehensive report with strategic insights. Export to PowerPoint, HTML, or Markdown for easy sharing and presentation.
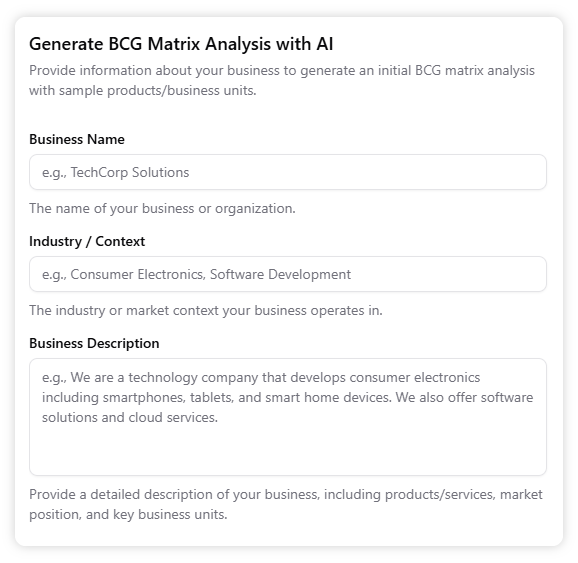
Stop listing products manually and start visualizing your portfolio. Our new AI feature analyzes your business and industry to instantly generate a foundational set of plausible products or business units and suggest their strategic placement within the BCG Matrix.
Define Your Context, Get Your Portfolio Drafted
By providing your core business context, the AI simulates a typical portfolio structure for that industry, allowing you to move directly to validation, data input, and strategic decision-making.
Key Inputs for AI Generation:
Business Name
Industry/ Context
Business Description
This integration ensures a fast, structured, and strategic start to optimizing your product portfolio.
Stop guessing and start strategizing. Gain the clarity you need to drive growth and maximize profitability. Launch the free tool and build your first BCG Matrix in minutes.
