 Visual Paradigm Desktop |
  Visual Paradigm Online
Clear communication is one of the biggest challenges in software projects. Developers, architects, and business stakeholders often use different terms, making it difficult to align expectations.
Deployment diagrams bridge this gap by providing a visual language that everyone can understand. They show how software components interact with hardware, helping both technical and non-technical team members grasp the system’s structure.
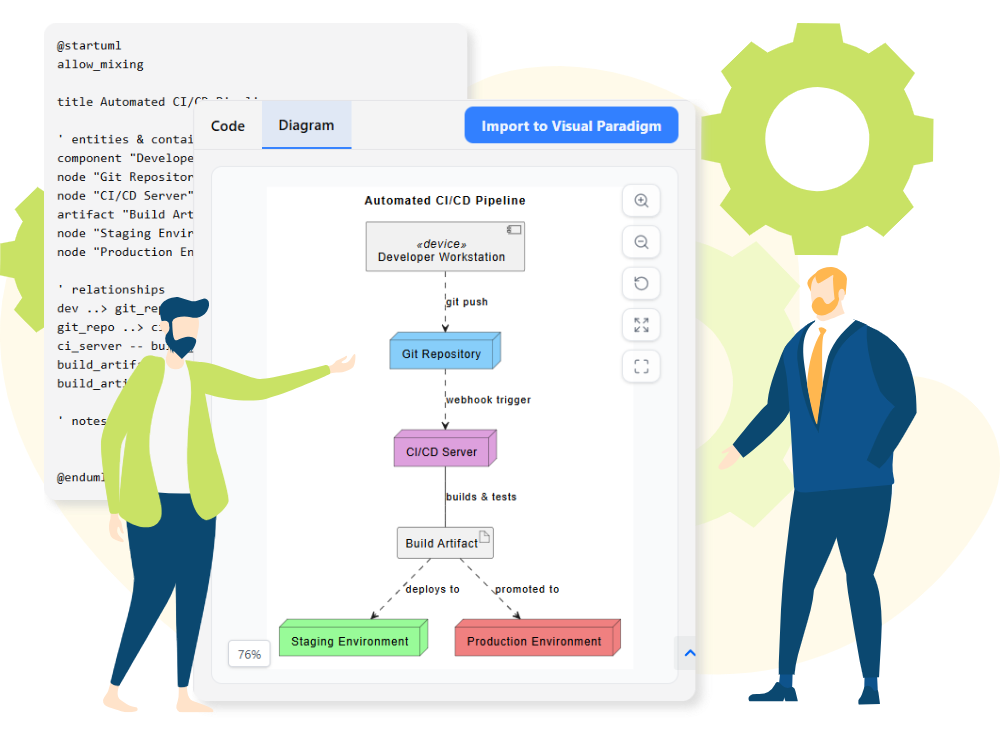
Show which software components run on which nodes or servers.
Display how components, devices, and connections work together.
Define what is inside and outside the deployment environment.
This shared representation reduces misunderstandings and ensures everyone is looking at the same picture.
By offering a common reference point, deployment diagrams encourage alignment across the team.

In large-scale or distributed teams, miscommunication can lead to duplicated work, incorrect assumptions, or delays. Deployment diagrams provide:
Deployment diagrams are more than just a technical tool — they are a communication asset. By presenting a clear, visual representation of the runtime environment, they help architects, developers, and stakeholders collaborate effectively and keep projects on track.
