 Visual Paradigm Desktop |
  Visual Paradigm Online
Use case diagrams are powerful, but once <include> and <extend> relationships multiply, the visual layout can quickly get messy. Lines cross over, actors get pushed around, and the diagram becomes harder to interpret. Before trying to make sense of the visuals, it helps to first break down the information into a clear, structured table.
A diagram shows the big picture, but a table gives you the details in an organized way. By converting relationships into a table with columns like:
You get an instant overview of the system logic without fighting through overlapping connectors. For example:
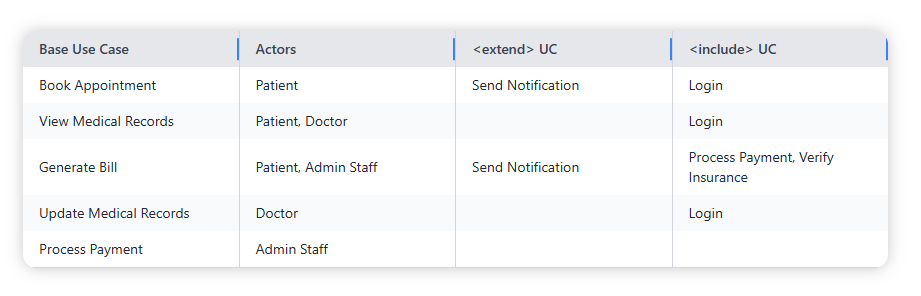
This format makes it easy to answer questions like:
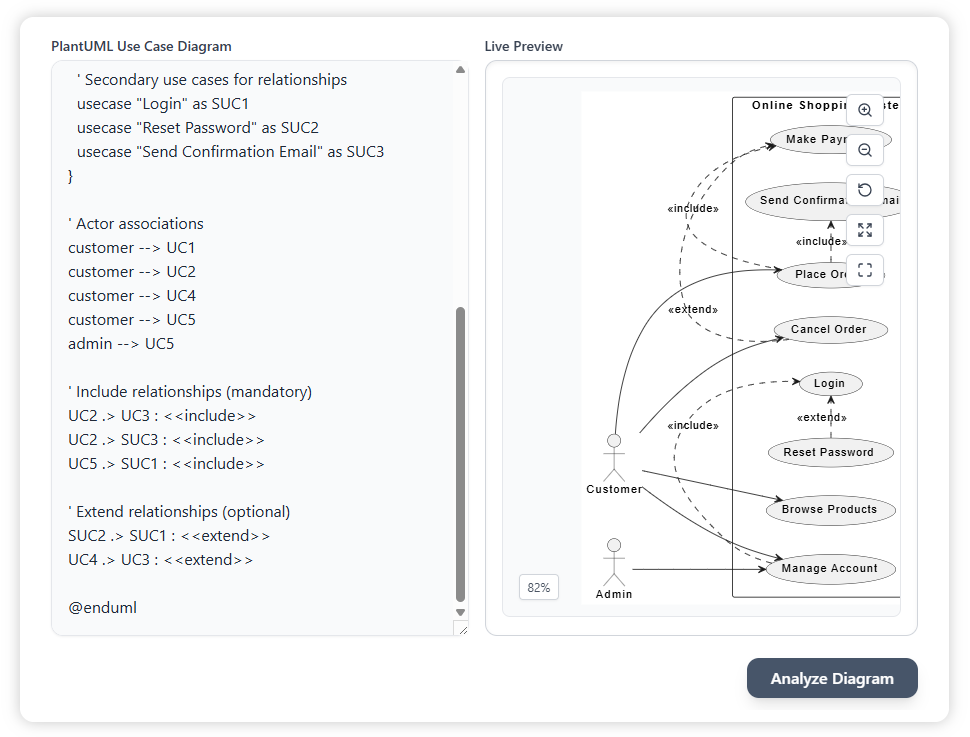
Once relationships are clear in table form, visualization becomes meaningful again. Instead of seeing a cluttered diagram, you can generate a focused sub-diagram that shows only the relationships for a specific use case.
This way, the diagram is no longer overwhelming—it is a direct visual representation of the structured table you just saw.
The Extend and Include Use Case Analyzer is designed exactly for this workflow:
By moving from table to visuals, the tool helps you first understand the logic, then see it clearly in a diagram. Instead of relying on PlantUML’s auto-layout alone, you get a guided path from raw text to structured insights.
When relationships are too complex to read directly in a diagram, stepping through a table first ensures that nothing is missed.
