Visual Paradigm Desktop |
  Visual Paradigm Online
A University Enrollment System centralizes and simplifies the student registration process by integrating course selection, enrollment verification, and prerequisite checks into one cohesive platform. It ensures students, advisors, and administrators can manage registration efficiently, while keeping seat availability, approvals, and institutional rules in sync.
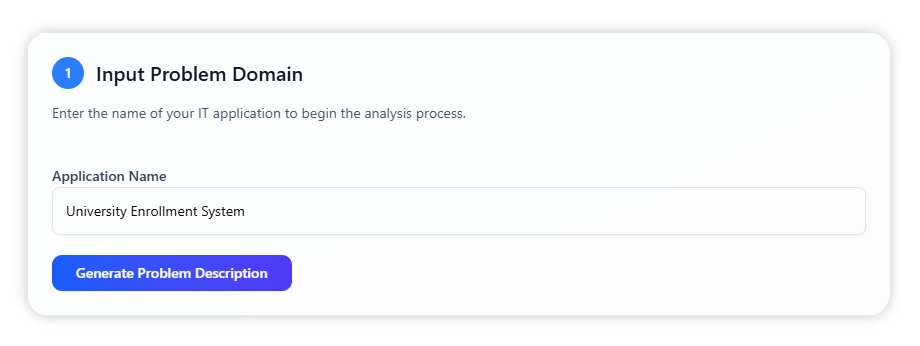
Provide the problem domain: University Enrollment System. This step supplies the AI with the core context it needs to outline the platform’s scope, its primary user roles, and the essential processes involved in enrollment.
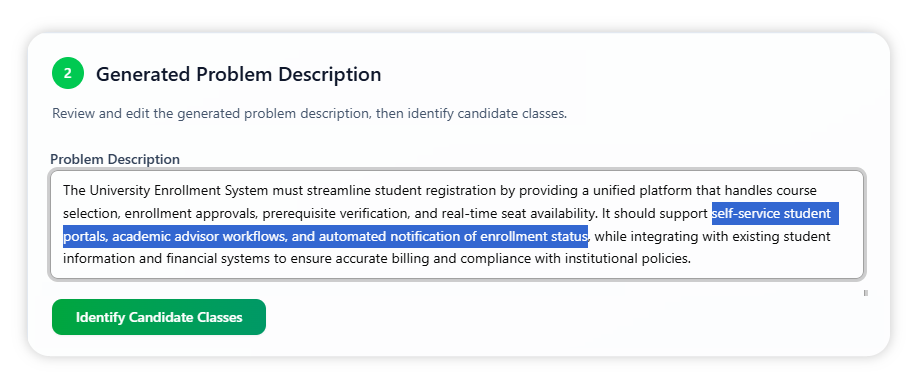
From the domain name, the AI composes a full problem description, incorporating elements such as real-time course availability, automated prerequisite validation, approval workflows for academic advisors, and integration with student records and billing systems. This text can be edited so it precisely matches your university’s enrollment policies and requirements before moving forward.
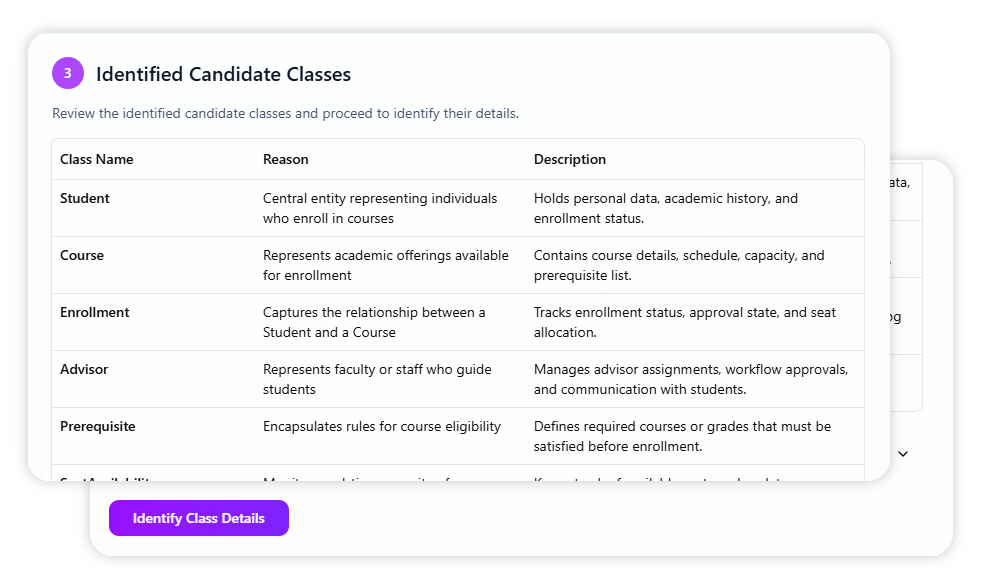
Based on the generated description, the AI identifies key domain classes—such as Student, Course, Enrollment, Advisor, and Prerequisite. Each proposed class includes an explanation of its purpose, the reason for its inclusion, and, where appropriate, notes on why some items may not meet the criteria for a domain class. All details are organized into collapsible sections for easier review.
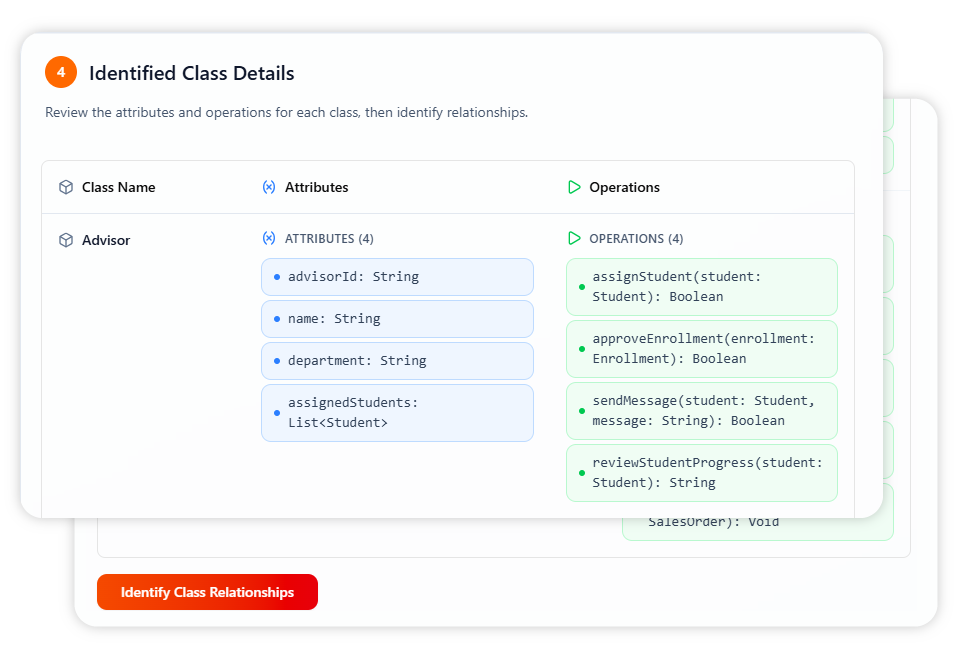
With the classes confirmed, the AI lists their attributes and operations. Attributes store defining information—like course codes, student IDs, or enrollment status—while operations cover the actions each class performs, such as enrolling a student or approving a course selection. Together, they provide a clear technical profile for each system entity.
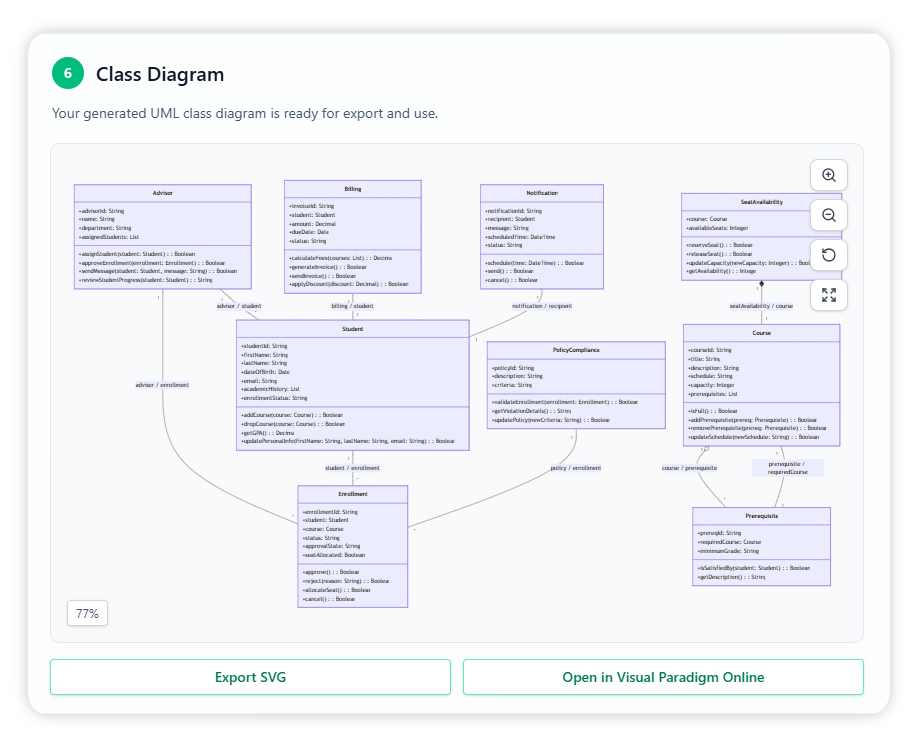
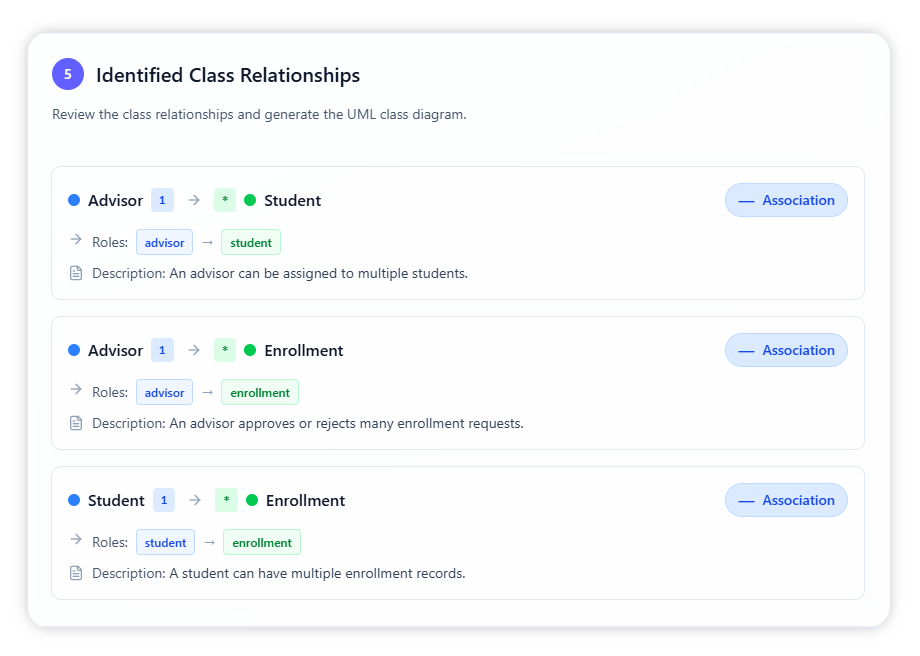
The AI then outlines the relationships among classes, showing which entities connect, the role each plays, and the nature of the connection, whether it’s association, aggregation, or composition. This mapping illustrates the overall structure and interaction flow of the enrollment system.
All confirmed classes, their attributes, and their relationships are compiled into a polished class diagram. You can open it directly in your browser, export it as an SVG, or edit it further using Visual Paradigm Online to suit your needs.