 Visual Paradigm Desktop |
  Visual Paradigm Online
Leverage the power of cutting-edge visualization technology with a user-friendly frontend.

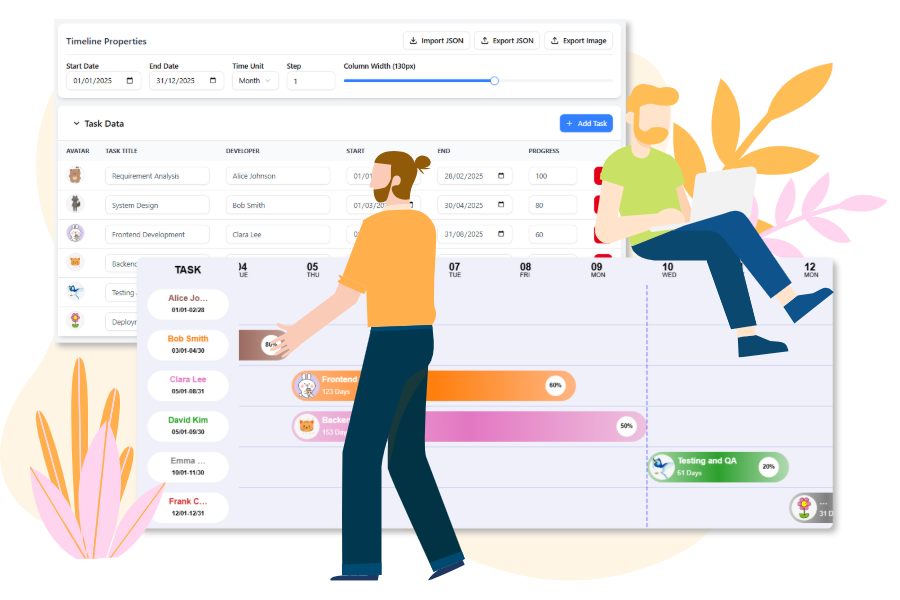
Interactive Timeline
Easily configure the Date Range, Time Unit (day, week, month), and Column Width using simple sliders and pickers.

Dynamic Task Editor
Manage tasks by adding progress percentage, set dates, and assign developers with customizable avatars.

Live Preview
See changes instantly on the Gantt Chart below to view the progess clearly in a visual way.

Image Export
Export the Gantt Chart as image to share your latest work to your team members.
Create your comprehensive project plan using only the visual interface.
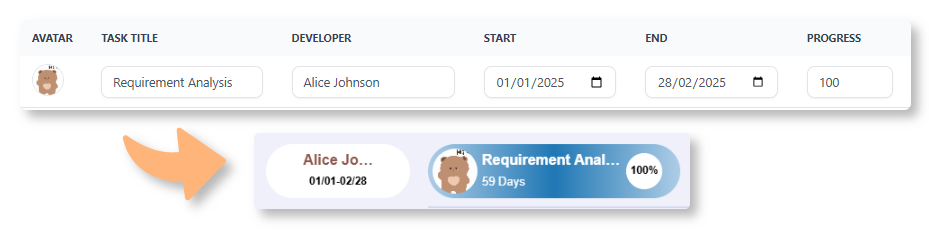
01 | Input Tasks in the Data Table
Enter each project task, including the Start Date, End Date, Assigned Team Member, and Progress (%), directly into the spreadsheet-like data editor.
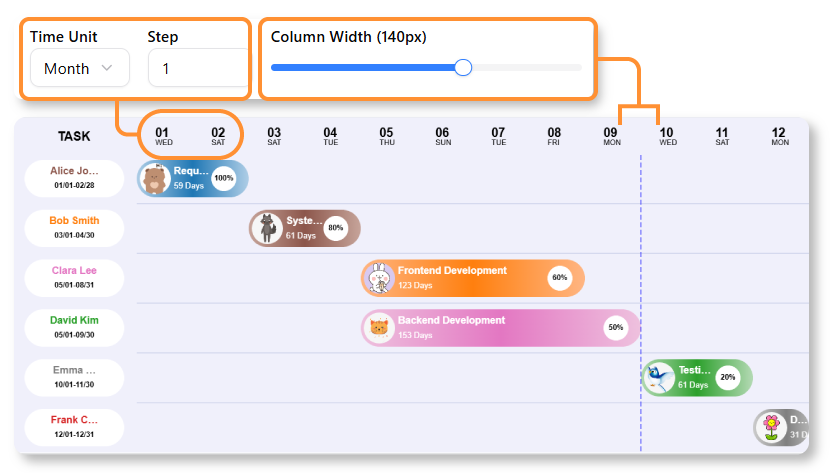
02 | Visualize & Customize the Timeline
Use the control panel to adjust the overall project Date Range and change the time scale from Days to Weeks or Months. See your tasks instantly rendered as interactive bars on the chart.
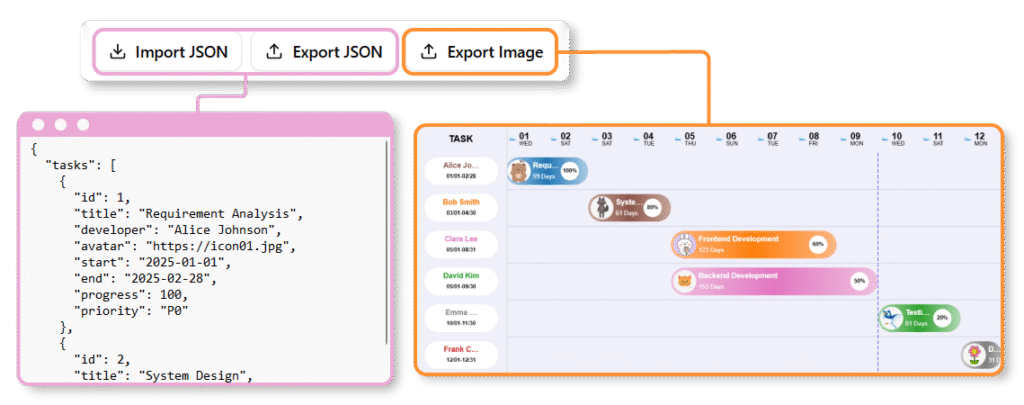
03 | Review & Export
Review and confirm the final visual output. You can export the Gantt Chart to image, and also share the data by the JSON to your team members.
This powerful tool is essential for anyone bridging project planning and technical implementation.

Project Managers
Visually map complex projects and track progress (0-100%) with ease.

Product Owners
Align engineering efforts with product roadmap milestones and timelines.

Marketing Teams
Plan multi-channel campaign rollouts and content publication schedules.

Software Developers
Quickly generate and test Gantt Chart configuration objects for easy integration.
