 Visual Paradigm Desktop |
  Visual Paradigm Online
If you’re a student in a computer science or IT class, you’ve probably heard of “use case diagrams.” They might sound complicated, but the idea behind them is actually very simple. Let’s break it down.
Imagine you’re ordering food from a delivery app. In this scenario, you are the main character. You perform actions like browsing restaurants, adding a pizza to your cart, and checking out. A use case diagram is just a simple drawing of this process.
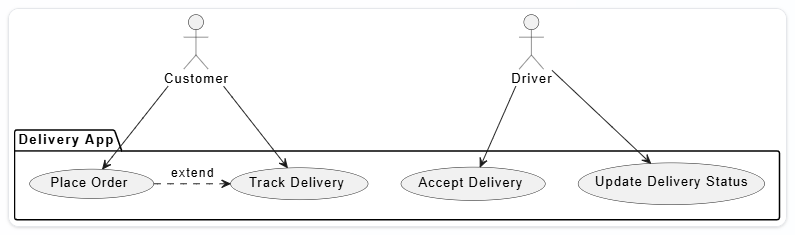
That’s it! A use case diagram connects actors (stick figures) to use cases (ovals) to show who can do what in a system. It’s a blueprint that helps everyone understand what a software application is supposed to do without getting lost in technical details.
A simple diagram showing a Customer (actor) who can Order Food (use case):
Drawing the diagram is often the fun part. The hard part comes next: writing a detailed report that explains everything. Your professor wants a document that describes all the actors, explains each use case, and lists all the relationships. This can take hours of tedious work, pulling you away from studying the actual concepts. You have to manually write things like:
“The Customer actor interacts with the Order Food use case. This use case is extended by the Apply Coupon use case…”
Doing this for a complex diagram is time-consuming and prone to errors.
This is where the Use Case Diagram Report Generator comes in. It’s designed to eliminate that boring, manual work. Instead of writing a report from scratch, you can focus on getting the diagram right.
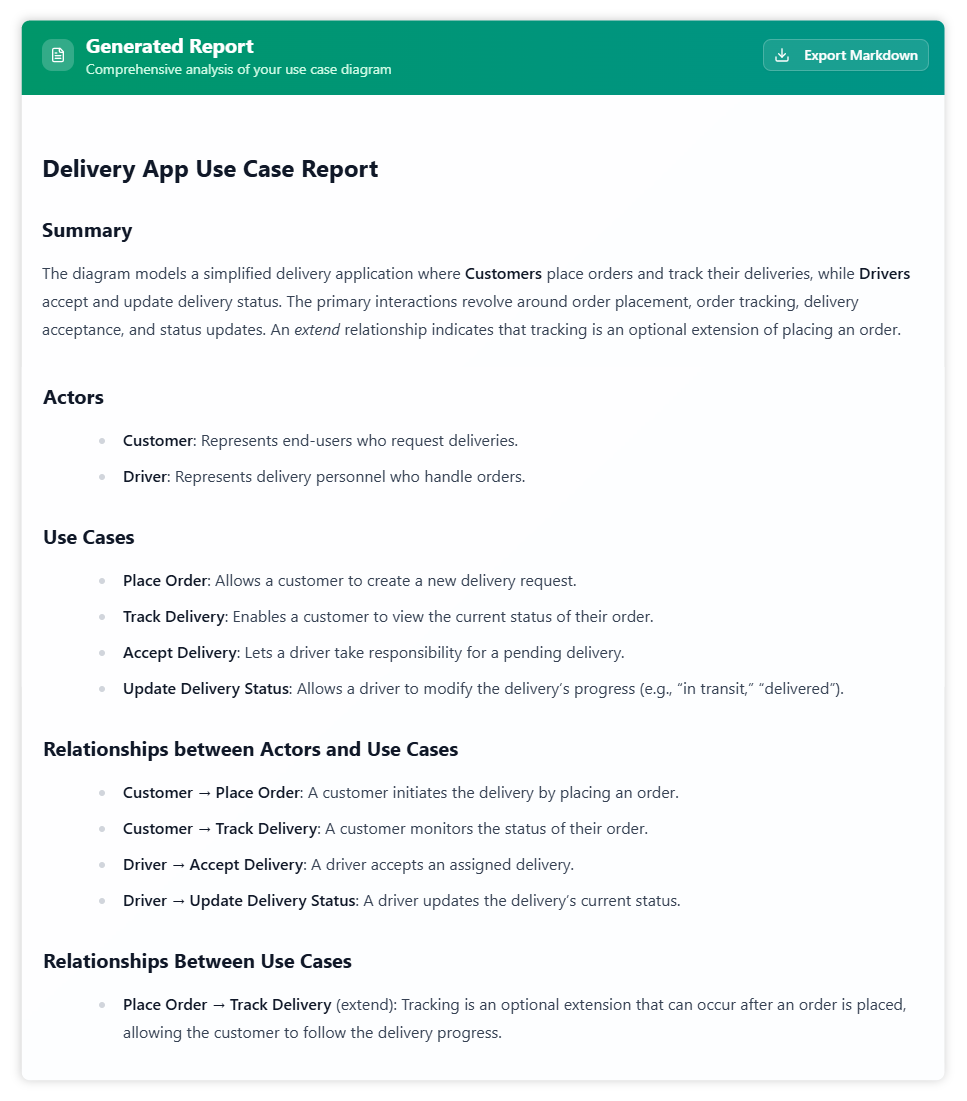
Here’s how it helps:
Instead of spending hours writing, you get a perfect report in seconds. This means you can focus on what really matters: understanding the principles of system design and acing your exams. It’s the ultimate study buddy for any tech student.
